Considering this is the largest estuary restoration project to occur on Vancouver Island, The Nature Trust of BC and partners in the West Coast Conservation Land Management Program (ECCC, DFO, Province of BC, DUC, HCTF) and Cowichan Tribes along with supporting consultants (Northwest Hydraulic Consultants Ltd., SmartShores, MC Wright and Associates, Thurber Engineering Ltd, Kerr Wood Leidal Associates Ltd., Millennia Research Ltd., SFU Salmon Watersheds Lab, Biologica Environmental Sciences) want to provide everyone with an inside look at the science involved in developing, implementing and monitoring a project of this scale.
Background
Filling, draining and diking for conversion to other uses has resulted in 70% loss of the original wetlands in the Fraser River delta and 60% of estuarine marsh habitat in the Salish Sea. Given that estuaries make up only 2.3% of BC’s coast, it is essential we conserve and restore these important ecosystems whenever possible.
Monitoring data collected over the last six years have indicated that the Cowichan Estuary will not be resilient to sea-level rise and will ‘drown’ or suffer from ‘coastal squeeze’ if this project is not undertaken. If we do not proceed with the restoration project, approximately 60% of the marsh habitat in the estuary will be lost under current scenarios by 2100 and will greatly impact fish, wildlife and the local community. The Cowichan Estuary Restoration Project will build in resilience for these crucial estuarine ecosystems.
To find out more about the background of the project visit here. We also have a video series entitled “The Living Estuary” which provides an in-depth look at the importance of estuaries to Pacific salmon, shorebirds and waterfowl, bears, harbour seals, river otters, benthic Invertebrates, crabs, Lyngbye’s sedge and sandhill cranes.
What professionals have been involved in this project?
To date, this project has involved Professional Biologists (RP Bio)(RB Tech), Engineers (P. Eng), Geoscientists (P. Geo) and Applied Science Technologists (ASct) all of which are governed by the Professional Governance Act 2021. The project is also working with Registered Professional Consulting Archaeologists (RCPA) as well as trained archaeological monitors and knowledge keepers from Cowichan Tribes. We are supported by academic researchers within Canada and the US with expertise on salmon, estuary restoration, climate change, carbon sequestration and resilience. The management team for the project has extensive experience in estuary restoration and monitoring projects and is also guided by a management committee that includes representatives from ECCC-Canadian Wildlife Service, Fisheries and Oceans Canada, Province of BC, Ducks Unlimited Canada, The Nature Trust of BC and the Habitat Conservation Trust Foundation.
What methodology was used to collect the data to determine marsh resilience?
This link will take you to a detailed presentation of the science and methodology used to assess estuary resilience not only at the Cowichan Estuary but at 15 other sites throughout British Columbia. Additional information regarding the development of the Marsh Resilience to Sea-Level Rise (MARS) tool can be found here. The detailed scientific article explaining the MARS tool can be found by following this link to the scientific journal Biological Conservation. We have also incorporated recommendations and methodologies in the detailed scientific review of “Understanding tidal marsh trajectories: evaluation of multiple indicators of marsh persistence”.
What is the relative sea-level rise calculation for the Cowichan Estuary? How was it calculated?
Our project worked with Smart Shores to assess relative sea-level rise for all of our 15 monitoring sites.
Overview
The land surface is constantly moving. The elevation of a given plot of land or point on the earth’s surface is influenced by short-term, intermediate and long-term geological processes. These affect the function and appearance of ecosystems, as well as estimations of sea-level rise.
Short-term processes include sediment erosion and accretion. These phenomena occur at the earth’s surface, at very fine spatial scales, are often observable with the naked eye and can be easily measured. For example, we used sediment cores and radiometric dating to determine rates of long-term sediment accretion, surface elevation tables (SET) readings, marker horizon plots, and survey equipment are all used to quantify short-term processes.
Intermediate and long-term processes are equally important in estimating relative sea-level rise. These processes – referred to as land velocity – include vertical and horizontal shifts in bedrock influenced by changes in ice mass and the movement of tectonic plates. Land velocity can lead to functional ecosystem change over intermediate (decadal) and long-term time scales (millennia) by exposing land to, or removing it from, the reach of the sea. These processes are imperceptible to the naked eye and are much more difficult to measure, requiring years of data from precise instruments over a large geographic range. For this reason, the baseline land velocities for this project were extracted from the NAD83v70VG National Crustal Velocity Model.
Methodology
Rates of mean sea-level rise are based on the range presented in the International Panel on Climate Change (IPCC) 5th Assessment Report. RCP8.5 was selected because it represents the upper bound of the set of likely emissions scenarios and is broadly aligned with recent global emissions. Given that sea-level rise will continue beyond the project horizon of 2100, an increase in sea-level beyond the RCP scenarios is possible due to either a partial collapse of the west Antarctic ice sheet, an acceleration in melting permafrost or a megathrust earthquake may cause sudden subsidence, this upper bound of expected sea-level rise is a justifiable scenario.
The rate of relative sea-level rise at each site was assessed by comparing local land velocities using the new Natural Resources Canada (NRCan) NAD83v70VG National Crustal Velocity Model rasters to adjust RCP8.5 sea-level rise estimates relative to the land movement. To account for the uncertainty associated with projecting sea-level rise 80 years in the future we identified potential future sea-levels for three scenarios and three planning horizons. The three scenarios are the median, low and upper confidence intervals (90% confidence range) of the RCP8.5 pathway. The three panning horizons are relative sea-level mid-century (circa 2050), at the year 2100, and at the year 2100 including the partial collapse of the west Antarctic ice sheet. For this assessment, the contribution to sea-level from the collapse of this ice sheet was set at 65 cm.
All sea-level rise estimates are relative to a baseline time. For the purposes of this project, our baseline is the year 2020. Therefore, for the purpose of this document, total sea-level rise at all sites in the year 2020 is 0.0 m. All projections presented here are for changes relative to the 2020 baseline.
How did you determine that 60% of the marsh vegetation would be lost?
Utilizing the relative sea-level rise estimates along with ecosystem mapping work completed by MC Wright and Associates, Smart Shores developed a model to assess the relative changes in Estuary Marsh and Estuary Meadow distribution in response to rising seas.
Based on the monitoring information and reports, what are the results for the Cowichan?
Sea-level Rise
- Relative sea-level rise was estimated to be 28 cm by 2050 (9 mm/year) and 78 cm by 2100 (9.5 mm/year 2050-2100).
- In a scenario combined with Antarctic ice sheet collapse – 141 cm by 2100.
Sediment Accretion
- Short-term sediment accretion measured at 4.1 mm/year. – half the rate of relative sea-level rise
- Long-term sediment accretion (radiometric dating) measured at 1.1 mm/year. – 8 times slower than relative sea-level rise
Estuary Vegetation Change
- The habitable intertidal zone for marsh vegetation will decrease at a rate of 0.6% per year from now to 2050, increasing to 1% per year from 2050 to 2100.
- High marsh vegetation will decrease by approximately 47% by 2050, being either drowned out or replaced with low marsh vegetation (which will expand by ~1% from its current extent).
- By 2100, high marsh vegetation will decrease by approximately 92%, being either drowned out or replaced with low marsh vegetation.
- By 2100, the overall estuary marsh area will decrease in area by 59% without intervention.
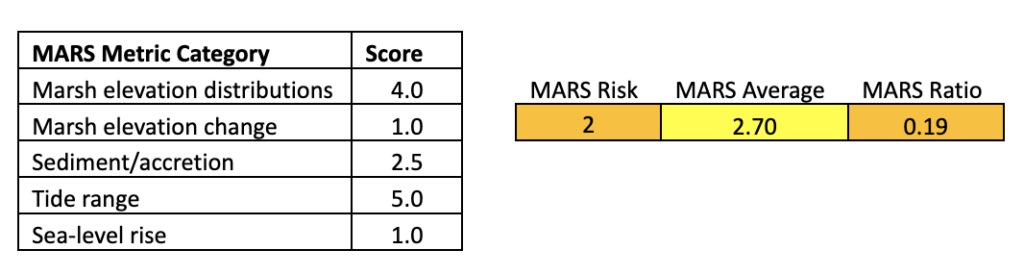
What is the MARS resilience score for the Cowichan Estuary?
MARS resilience scores were calculated using our monitoring data and the open-source data analysis platform provided by the National Estuary Research Reserve. Following designated criteria in the analysis, scores are assigned 1-5, where 1 represents the lowest resilience to sea-level rise and 5 is the highest.
RISK: Is overall resilience score and identifies estuaries that are at risk
AVERAGE: Overall average across the five resilience metric categories
RATIO: Scores <1 indicate that marshes are not gaining elevation at rates commensurate with sea-level rise
The MARS resilience scores are summarized below; the Cowichan estuary is at risk.
How did you determine what restoration projects to do using this information?
In 2021 our project team worked with Kerr Wood Leidal on an initial Estuary Resilience Restoration Scoping study that undertook an initial review of all of the monitoring sites to identify high-level opportunities for restoration. A key component of this included the development of an Evaluation Matrix to assess potential projects based on several project categories including: Resilience, Certainty of Success, Land Status, Project Risk, Liability Concerns, Constraints, Timing, Capital Cost, Cost per Hectare, Operations and Maintenance Effort, and Regulatory Effort. These categories were provided with a score and then reviewed by experts (biologists, engineers) for final assessment/adjustment.
This initial assessment identified 4 high-priority projects for the Cowichan Estuary (Dinsdale dike removal, Koksilah remnant berm removal, hydraulic reconnections and sediment augmentation).
The monitoring data collected and the scores produced for each site (identified above) were compared to the KWL report to validate the identification of the projects and the impact they would have on enhancing estuary resilience. For the Cowichan, the resilience scores re-confirmed the need to implement restoration activities.
With that validation about the importance of the projects, what happened next?
With the identification of the projects and the validating information, the project then proceeded to conduct detailed analysis and assessments of the component projects. This work not only included detailed physical process studies but we also began work with archaeologists and developed a detailed biological monitoring plan to assess baseline biological indicators pre/post restoration.
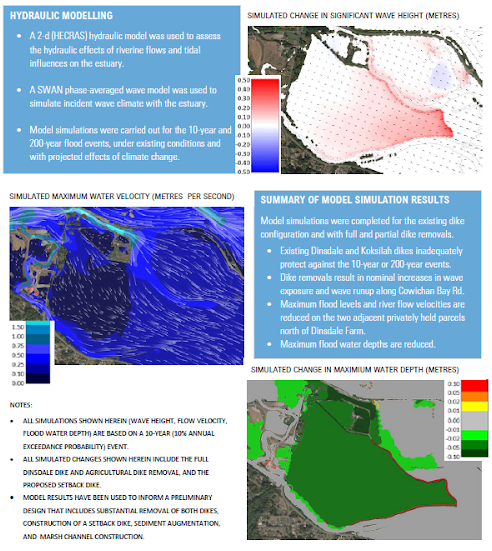
The physical processes study and feasibility assessments
In order for the project to advance from the conceptual stage we hired Northwest Hydraulic Consultants Ltd. (NHC) to undertake detailed studies of the potential projects. This was a requirement not only to determine project feasibility but to also meet the requirements for the “Decommissioning of a Regulated Dike” under the Dike Maintenance Act (DMA).
NHC completed a report entitled: “Cowichan Estuary Marsh Restoration Project: Assessment of Physical Processes and Restoration Opportunities”. This assessment involved 14 experts in their field ranging from geomorphologists, coastal engineers, hydrologists, hydraulic modellers, hydrometric monitors, river engineers, diking specialists, GIS specialists and involved biologists from the Nature Trust and Cowichan Tribes.
The work included the completion of an assessment of the Physical Setting of the estuary and restoration area and included: Anthropogenic History; Existing Land Use and Infrastructure; Geological Setting; Hydrology (watershed overview, hydrometric data, seasonal flow regime, flood hydrology, distribution of freshwater flows to estuary); Hydraulic Conditions (hydraulic model development; simulations of flood events); Ocean and Coastal Setting (tides, storm surge, sea-level rise, winds, wind-waves); Geomorphology (channel characteristics, sediment input and mobility, sediment composition, accretion rates); and Ecological Context.
In addition to the assessment of the Physical Setting an assessment of the Existing Level of Protection in the estuary was also completed and included inferred flood and erosion protection along with hydraulic and wave modelling. From this background work, feasibility assessments were completed for the Koksilah Marsh old agricultural berm removals, sediment augmentation and finally the removal of Dinsdale Dike. Each of these feasibility assessments included specific hydraulic and wave models for each project component. A part of the assessment of the project components also identified any mitigation works to make sure adjacent properties are still provided the same level of protection or better as a result of this project. Mitigation works identified for this project include constructing a setback dike structure on the old farm access road, leaving small spurs at the Koksilah Marsh and raising Lochmanetz Road.
This report concluded that not only were the projects feasible in terms of enhancing estuary resilience but that they would improve the flood conditions in the project area and surrounding land through the increased conveyance of riverine flood waters.
The figure below provides an overview of some of the modelling results with the full Dinsdale dike removal and the complete removal of the Koksilah marsh agricultural berms (note: Phase 1 has been completed and the berms were not completely removed as some spurs were left in place).
The third image shows the change with the project being completed in terms of flood depths. Green represents a positive change in flood depths in that the depth of the water is reduced. Gray indicates no change and red indicates an increase in water. It is important to note that the flood depths are reduced for the majority of the properties in the area or there is no change from current conditions.